In the hotel business, tracking the right performance indicators is non-negotiable. Key metrics like RevPAR and ADR help hoteliers understand revenue flow, optimize pricing, and measure how well their property is performing. In an increasingly competitive market, evaluating performance through accurate hotel KPIs allows hoteliers to make proactive decisions that directly influence occupancy, guest satisfaction, and profitability.
Here’s a breakdown of the most critical KPIs every hotel should monitor, along with practical ways to apply them.
1. Total Available Rooms (TAR)
Total Available Rooms form the base for several hotel metrics, especially revenue-related ones. This is calculated by multiplying the total number of sellable rooms by the number of days in a selected period. For example, a hotel with 100 operational rooms in a 30-day month has 3,000 available room nights. This figure becomes the foundation for performance analysis and forecasting.
2. Average Daily Rate (ADR)
ADR shows the average income earned from rooms sold, offering insight into pricing effectiveness. It helps hoteliers benchmark revenue performance and adjust room rates depending on seasonality and competition.
For instance, if you earned INR 5,00,000 by selling 250 rooms in a month, your ADR is INR 2,000. While ADR doesn’t consider unsold rooms, it gives a focused view of rate efficiency per booked room.
The latest industry trends show impressive ADR resilience, with U.S. hotels reporting an ADR of $161.78 in March 2025, a 1.1% year-over-year increase despite economic pressures. In global gateway cities, New York achieved remarkable ADR growth of nearly 6% in 2024, reaching approximately $319, significantly outpacing inflation rates during the same period.
3. Revenue Per Available Room (RevPAR)
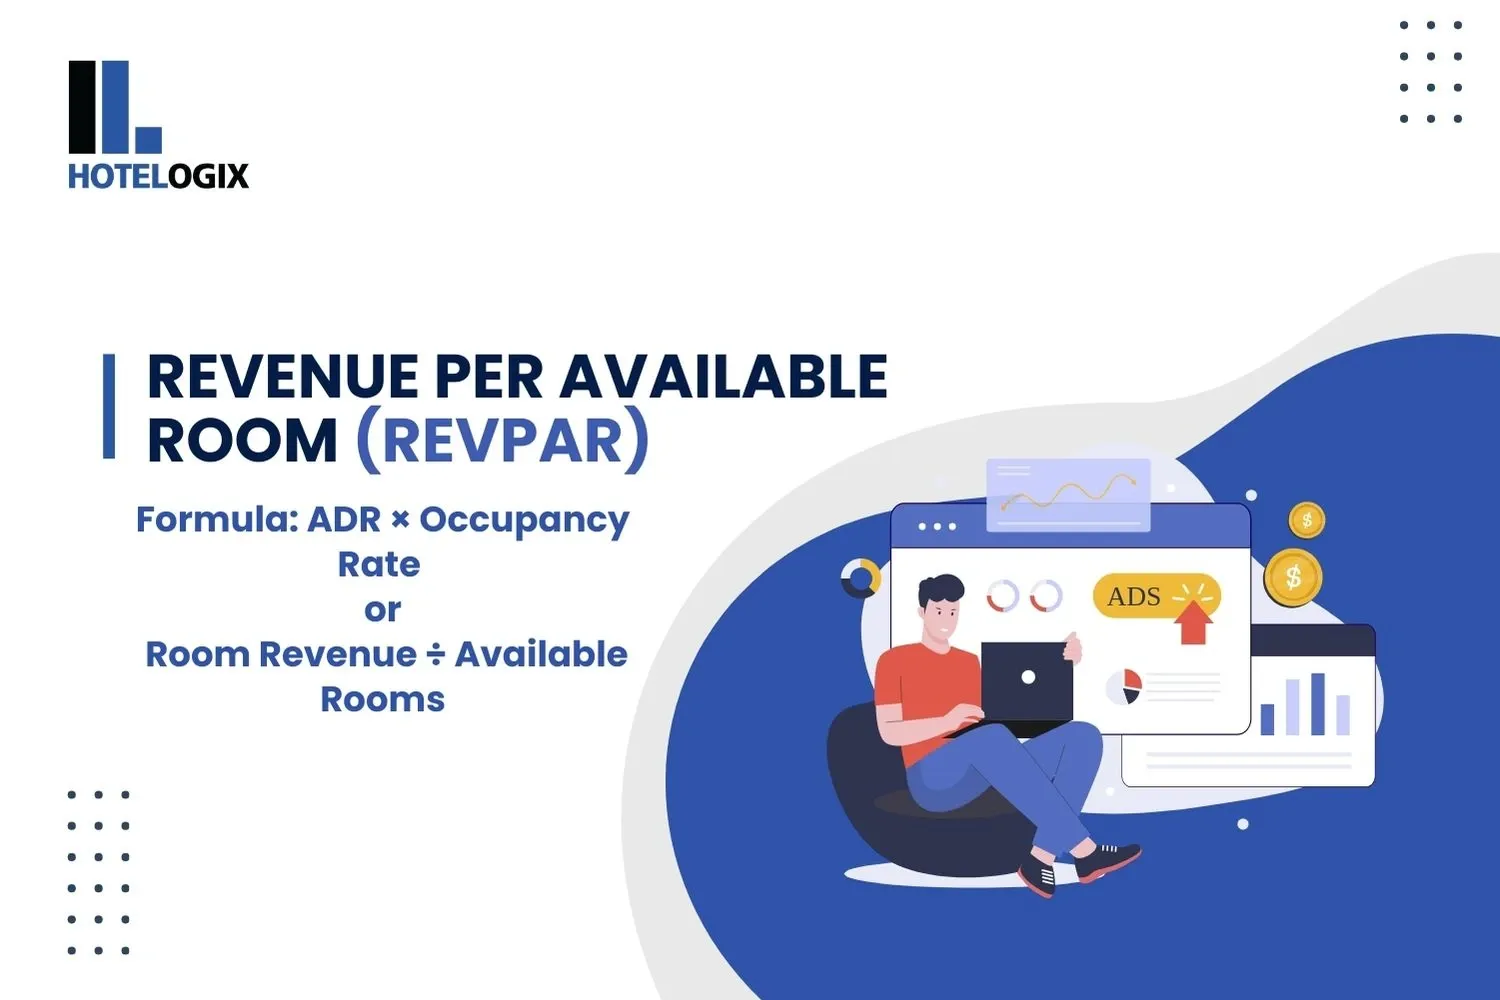
RevPAR is one of the most important KPIs in the hospitality industry. It blends room occupancy and ADR to reflect revenue generation capability from available inventory.
If your ADR is INR 2,000 and occupancy rate is 75%, your RevPAR would be INR 1,500. This metric helps hoteliers evaluate how pricing and occupancy jointly affect room revenue.
4. Occupancy Rate (OCC)
Occupancy Rate shows the percentage of rooms sold compared to those available. It is a straightforward indicator of demand and can be tracked daily, weekly, or monthly to assess trends.
If 75 rooms are sold out of 100 available rooms, your occupancy is 75%. Monitoring this regularly helps identify booking patterns and gauge the effectiveness of promotions and distribution strategies.
Recent data reveals interesting regional variations in occupancy performance. For Q1 2024, Singapore led with impressive 77% occupancy rates, while Hong Kong reported 73%. Elite destinations including Dubai, London, Mumbai, and Sydney all achieved approximately 80% occupancy during this period, setting benchmarks for global performance standards.
5. Average Length of Stay (LOS)
LOS measures how many nights guests typically stay. A longer average stay reduces turnover costs and increases profitability per booking.
For example, if you have 600 room nights across 200 bookings, the LOS is 3 nights. Hotels with longer LOS often experience better labor and housekeeping cost efficiencies.
6. Market Penetration Index (MPI)
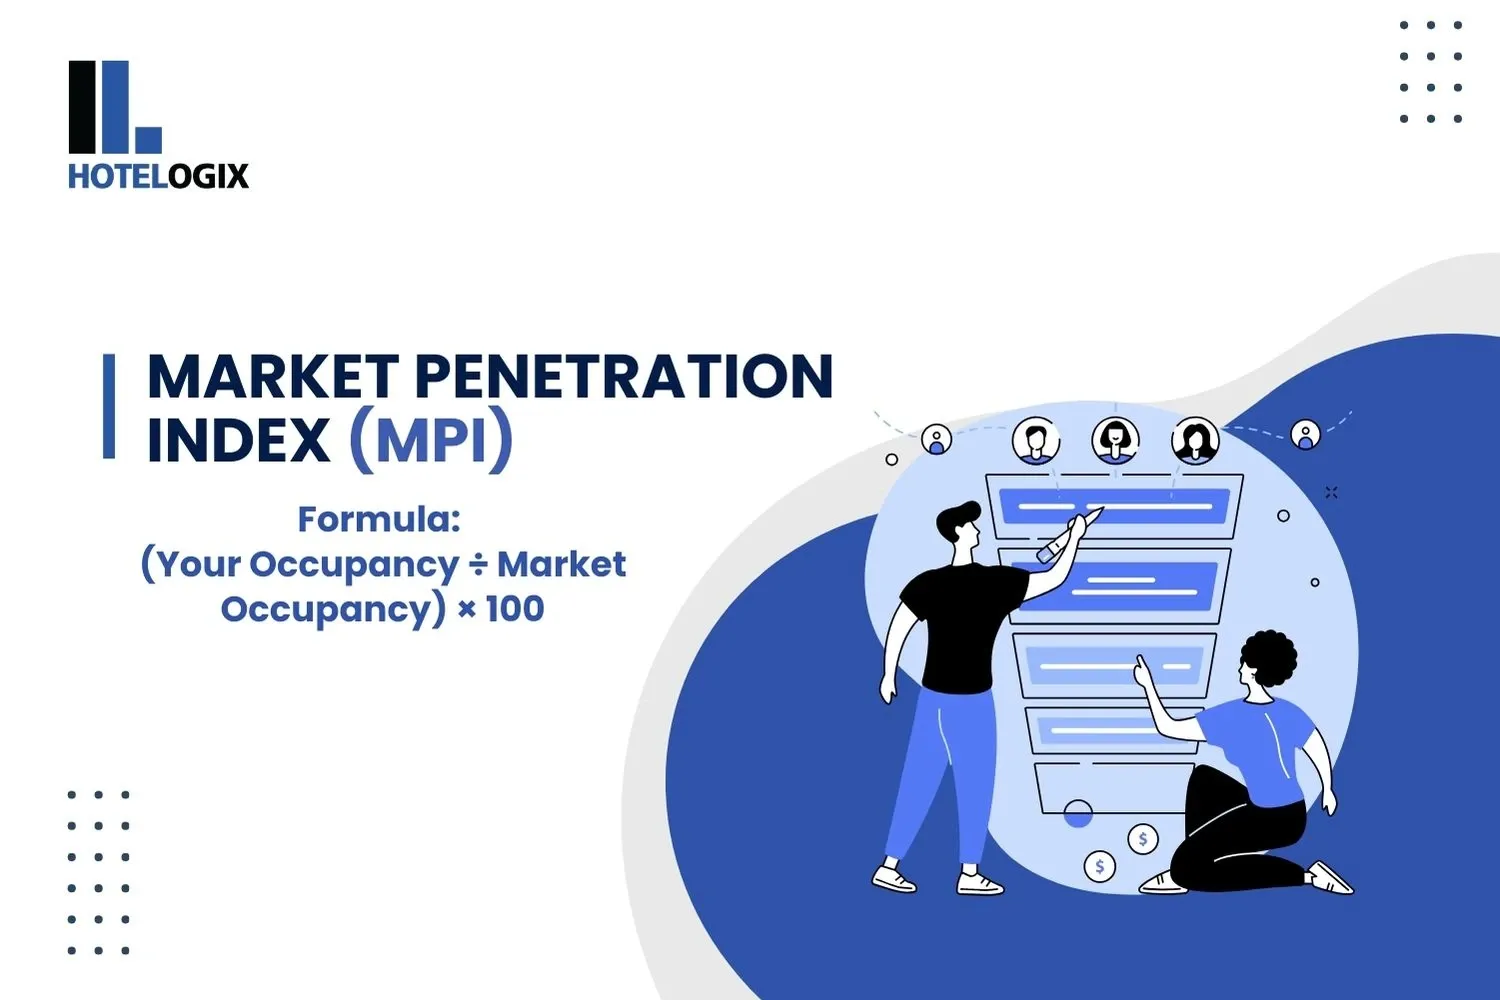
MPI compares your property’s occupancy to your competitive set. It reveals how well you are performing in terms of capturing demand in your market segment.
An MPI above 100 indicates you’re outperforming competitors. It’s a useful metric when assessing the effectiveness of your marketing, rate positioning, and guest acquisition strategy.
7. Gross Operating Profit Per Available Room (GOPPAR)
Unlike RevPAR, GOPPAR considers all operating revenues and expenses. It provides a holistic view of overall profitability, helping hoteliers evaluate departmental performance and cost management.
If your property’s gross operating profit is INR 12,00,000 and you have 3,000 available rooms, your GOPPAR is INR 400. This KPI is essential for owners and investors tracking ROI.
8. Cost Per Occupied Room (CPOR)
CPOR measures the cost incurred for each room sold. It includes fixed and variable expenses and helps identify inefficiencies in operations.
If your monthly operational cost is INR 5,00,000 and you sell 250 rooms, CPOR is INR 2,000. When paired with ADR, it clearly shows whether your pricing supports profitability.
How Hotelogix PMS Helps Hoteliers Track These KPIs
With Hotelogix PMS, you get access to over 100 pre-configured reports designed specifically for the hospitality business. These include:
- Daily, monthly, and annual Revenue and Occupancy reports
- Departmental performance breakdowns
- Forecast vs. actual reports
- Market segment and source analysis
The system consolidates data across departments and properties, offering real-time dashboards for GMs, revenue managers, and owners. Whether it’s analyzing a drop in RevPAR or spotting rising CPOR trends, the PMS delivers actionable insights instantly.
Hotelogix also integrates with your POS and channel manager, ensuring that all revenue streams and booking sources are accurately captured in your KPIs. This saves hours of manual consolidation and allows quicker, smarter decision-making.
For multi-property groups, Hotelogix offers centralized reporting, so stakeholders can evaluate each property's performance individually or collectively across a region or brand.
Conclusion
Performance metrics aren’t just numbers—they are vital indicators of your hotel’s financial health, operational efficiency, and competitiveness in the market. As a hotelier, regularly tracking KPIs like RevPAR, ADR, Occupancy Rate, and GOPPAR allows you to uncover gaps, seize growth opportunities, and make informed business decisions.
With a robust PMS like Hotelogix, this process becomes simpler, faster, and far more accurate. You don’t just collect data—you turn it into strategy. Adopt these essential metrics and tools today to stay on track and set your hotel on a path to sustainable success.